02 Aug 7 Social Media Metrics that Really Matter—and How to Track Them
By Sarah Dawley
When your boss asks you for the ROI of your latest social media campaign, how do you respond? Too many social media managers fall back on the easy answers: we gained this many new Twitter followers, this many Retweets, this many Facebook shares, and so on. Sure, these social media metrics offer surface insights into how a campaign or piece of content performed, but they don’t really show executives how your efforts are helping boost the bottom line.
It’s time to step things up a notch so that your social media analytics better reflect how all your hard work is paying off. Here’s a list of social media metrics you may already be tracking and how to take them to the next level.
7 ways to step up your social media analytics
1. Don’t just track link clicks, track click-through with bounce rate
If you share original content to social media, you’re probably already tracking how many people click-through to that content. Click-through rates are important as a metric, since they indicate that your social media messaging is compelling enough to spark interest with your audience. But these clicks become a far more telling metric, at least in terms of ROI, when paired with your bounce rate.
Bounce rate refers to the percentage of page visitors who leave your website after only viewing one page. In the case of social media, it would reflect someone clicking on a link you post to Twitter or Facebook, arriving on your website or blog, then leaving without viewing any other content.
Ideally, we all want people to stay on our sites forever (or until they convert—whichever comes first). Bounce rate is an important metric to track for your web properties, in general, but why is bounce rate important as it relates to social media? It allows you to powerfully illustrate your social ROI by comparing it to your other sources of web traffic.
Track the bounce rate of website visitors who came from social networks, and compare that rate to website visitors who visited your site directly, arrived from Google, or arrived from any paid advertising campaigns. If your social media bounce rate is lower than those other sources, you can show your boss that you’re targeting the right people on social media, and the traffic you’re driving is more valuable to the business.
How to track this:
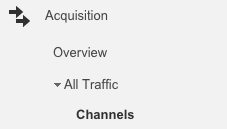
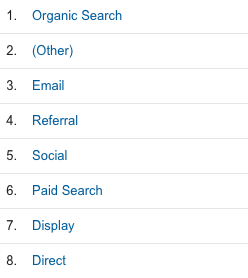
To track this metric, you need to be set up on Google Analytics or another analytics provider. In the case of Google Analytics, you’ll want to go to the “Acquisition” tab, and look under “All Traffic” for the “Channels” segment. Click on the “Bounce Rate” button and it should rank all of the channels from lowest bounce rate to highest.

In the example below, you’d be able to show your boss that social media is less effective than search and email, but more effective than search ads, display ads, and direct traffic to your website. That kind of insight should go a long way as you try to prove the value of social media to your business.

2. Don’t just track web referrals, track share of traffic driven
If search has a bounce rate that’s twice as high as social media, but drives 20 times the traffic, social is still going to look less valuable in comparison. That’s why social media managers need to track more than just the amount of traffic driven, and start tracking the share of traffic driven by social.
Doing this, once again, puts social up against other marketing channels like search or display ads, in order to determine the real value for your business. If you have 100,000 website visitors this month, saying social drove 25,000 website visits might not be as powerful as saying that social drove 25 percent of website traffic this month, second only to search and well ahead of any other channel.
How to track this:
Tracking share of traffic driven can be done in the same place as your bounce rate. Within Google Analytics, under Acquisition and Channels, click on the “Sessions” field. This will rank all of the channels based on the number of sessions they drive. In the column, beside the actual number, you should also be able to see a small percentage figure. This percentage represents the share of traffic being driven by each channel. Easy, peasy. View Full Article >>


Sorry, the comment form is closed at this time.